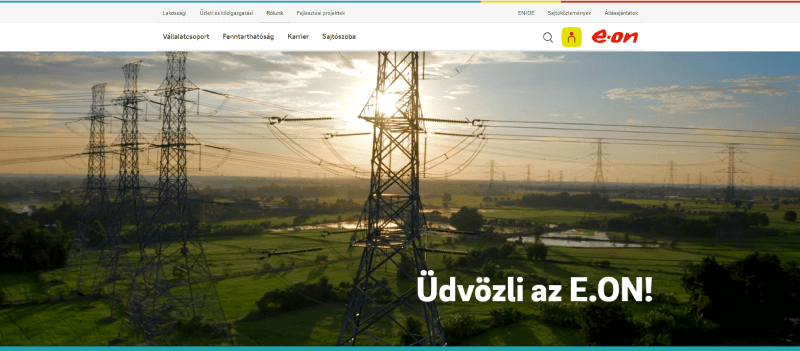
As a member of the international E.ON Group, E.ON Hungária is an important player in the Hungarian energy economy. In 2021, the company set a strategic goal for E.ON to become the green energy provider of the future, which involved the transformation of its own operations to meet climate goals.
The assessment of operational emissions also included, for the first time in its industry, a digital carbon footprint assessment and the identification of reduction opportunities. To monitor their website (and email campaigns), they have chosen Carbon.Crane’s solution, which has enabled them to significantly reduce the carbon footprint of these communication channels in 2023.
In this case study, we present the background and results of the optimization achieved for a website at https://www.eon.hu.
Tested website:
A website with over 1000 sub-pages is available at https://www.eon.hu
Objective:
To permanently reduce the website’s carbon footprint by using content optimization and technological options, while maintaining or even improving the user experience.
Implementation:
The main steps of implementation:
- measuring the website’s carbon footprint, examining pages and traffic impact,
- identifying the components responsible for emissions,
- assessing reduction potential and identifying specific reduction opportunities,
- initiating the optimization process and testing its effectiveness.
Implementation details:
At the start of the project, the Website Carbon Monitor was used to assess and visualize the emissions and the amount of traffic coming to each page of the website. By looking at the combined effect of these two factors, we identified the pages that have the greatest impact on the overall website carbon footprint, either because they are large, because they receive a lot of traffic, or a combination of both.
The method allows us to focus on selected sites, which is a huge help as it would require significant resources to tackle more than 1000 pages at once.
The next step is an in-depth analysis of the pages selected for reduction, highlighting oversized components (images, media content, fonts, scripts, etc.). Site operators are then able to optimize the site in a targeted and effective way.
Importantly, reduction is not only a matter of technology, but also of content. The necessity and parameters of content elements need to be determined (e.g. size of images, length of videos, font changes), but technology can also contribute significantly to reducing emissions through more suitable image or video formats, code and loading optimization, and green hosting.
The E.ON team has taken the following steps to achieve this reduction.
- The images on this website have been reduced in size.
- Duplicate and unused pages have been deleted
- Why review content for redundancy and relevance? Although primarily a content hygiene issue, it is important to know that storing any content item uploaded to a web server requires energy. While this is relatively minor, it can all add up to a significant amount, not to mention completely unnecessary. That is why this is perhaps the easiest and most painless optimization option.
- Video content will not start until it has been clicked on
- Why limit the “autoplay” function of videos? The automatic playback of videos on a page results in energy consumption and a carbon footprint for each and every page load. Even if the visitor does not engage with them, does not watch them. If the decision to view is placed in the hands of the user, these emissions are only generated when someone actually consumes the audiovisual content on the page. Emissions are generated then, but only then.
Results:
- The carbon footprint of the entire website has been reduced by almost 20%.
- Carbon emissions have been reduced by around 1 ton of CO2e in 2023 (compared to 2022) thanks to the optimization – important note that this is not the result of a reduction in traffic.
- The reduction has resulted in energy savings of more than 4 MWh, equivalent to the electricity consumption of a household of four for a year and a half.
| “As the head of digital, I believe it’s crucial that we keep the carbon footprint of our digital asset base as low as possible. We have received excellent support for our efforts from the team at Carbon.Crane, who are enabling us to achieve our goals in the most efficient way possible, with demonstrable energy savings and improved user experience for our website visitors.”
Dániel Szabó |


