As a datadriven marketing solution provider it is our professional conviction that, if possible, it is better to define values based on calculations rather than estimations, as it reflects reality much better. When developing the metrics, we aimed to make them easy to interpret and well describe the factors that affect the carbon emissions. That is why we didn’t overcomplicate them. We talked with Ákos Herdics, the head of our data team, about the professional foundations of our Carbon Monitors.
What is the essence of the Website Carbon Monitor?
Before I answer the question specifically, let me start with what brought our Carbon Monitors to life. We have seen that many companies try to accurately specify a number of items when determining their carbon footprint, but when it comes to marketing activities, most of the time they only determine some kind of estimated value. We want to leave behind this not-so-sophisticated practice. In our opinion, the carbon emissions from marketing activities carried out on individual communication channels can be determined much more precisely based on calculations. If we add up the amount of CO2e generated by each channel, we get the carbon emissions resulting from the entire marketing activity which reflects reality much better than previous estimates.
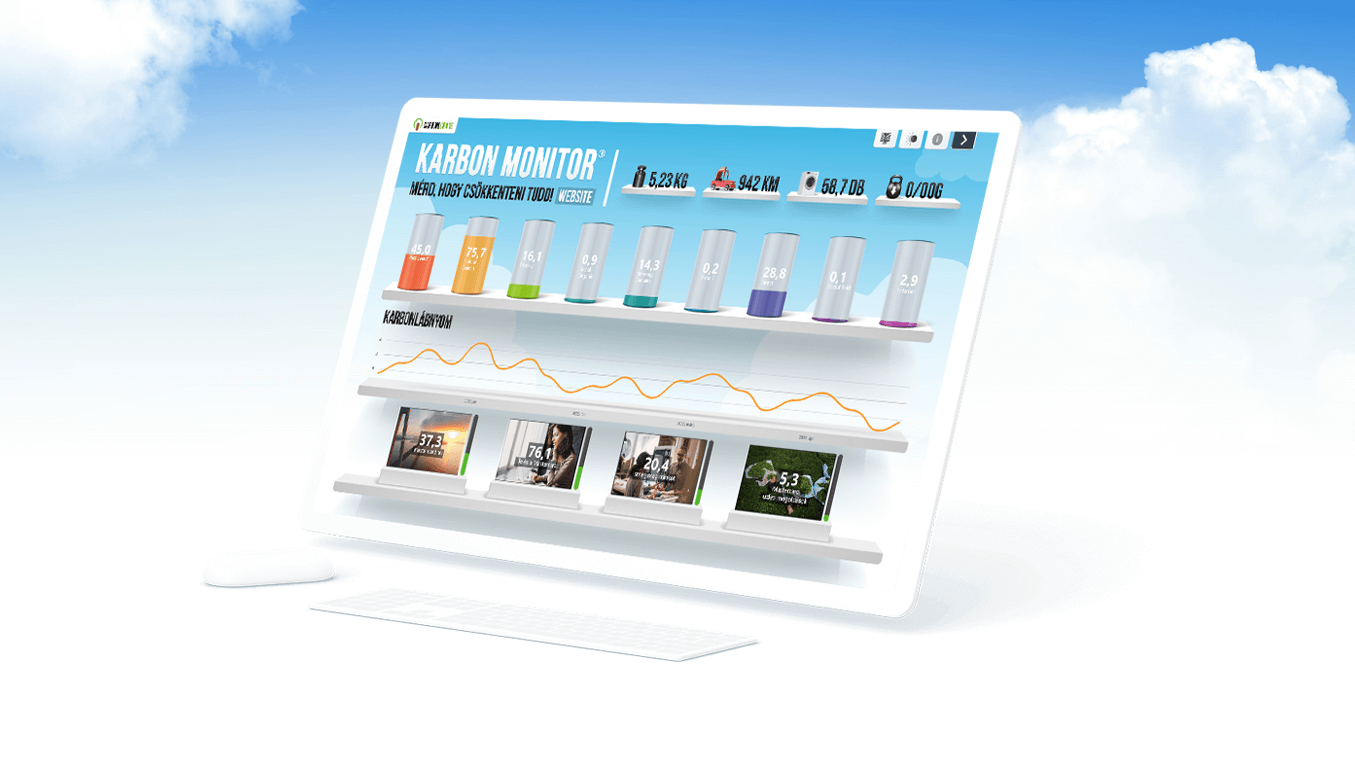
In addition to all this, we must not forget about websites either, since they also play a decisive role in a company’s marketing activity. Their operation, the published content and the traffic generated on the site are all factors that result in carbon emissions. The interactive dashboard system of the Website Carbon Monitor was created in order to be able to analyze and optimize the factors affecting the amount of CO2e generated by the website(s).
What metrics can we find in the report?
When developing the metrics, we aimed to make them easy to interpret and well describe the factors that affect the carbon emissions. That is why we didn’t overcomplicate them. Typically, we work with two important indicators.
One is the total carbon emission, which is the total amount of CO2e emitted by the website during a given period. But this number in itself is not informative enough, since we cannot judge whether it is too much or too little. For this reason, we have “converted” the entire carbon footprint to a few everyday activities, and we show how many kilometers of car journeys or how many heavy washes this corresponds to.
When measuring carbon emissions, we also apply the amount of CO2e per page view which makes it possible to compare the carbon emissions of individual pages/subpages. According to our experience, in the case of larger values, there is almost always a way to reduce it by optimizing the pages which in many cases can mean a 10-15 times smaller carbon footprint.
How do you calculate the CO2e emissions of a website?
The total CO2e emission of the website is determined by 2 main factors. One is the traffic generated by visitors and the other is the amount of CO2e resulting from the download of the given website.
The situation with traffic data is relatively simple, since behind almost every website there is some kind of web analytics system that can provide data continuously and from many aspects. Related to this, the most important visit data are available practically immediately.
The other important factor is the amount of carbon generated by the site. To measure this, we use uniformly accepted, public sources available on the Internet, which, after providing the web address of the page, analyze its content elements, code, fonts and many other properties. The amount of data associated with loading the page is first converted into electrical energy consumption and then into carbon emissions. And this is further corrected by the energy consumption of the server environment that ensures the running of the site.
If we have that and multiply it by the page downloads from the traffic data, we get the actual carbon footprint. Of course, if a website consists of several sub-pages, we do the same on these as well, and aggregate the CO2e amounts generated by them to determine the total carbon emissions.
How can you use what you see on the Carbon Monitor in real life?
The Website Carbon Monitor was designed in such a way that it is possible to point out the sub-pages that are responsible for the largest CO2e emissions in a matter of seconds. It can be seen from the analyses that the traffic or the not so carbon-friendly structure of the pages is responsible for this. If we see that the latter dominates then it is definitely worth thinking about optimizing them. How much scope to act there is in this varies: sometimes it is only possible to reduce the carbon emissions of a given sub-page by 10%, but it is not uncommon to raise it to 40 or even 50%.
To model this we have created a separate interface on the Carbon Monitor which can be used to estimate how much the carbon emissions of the entire website can be reduced by optimizing the most relevant sub-pages, calculating with the same number of visitors.
Can you also help with the carbon optimization of the subpages?
The short answer is of course yes. If the customer requests we will analyze their website and explore all possibilities that can be used to reduce CO2e.
Do the modifications to optimize carbon emissions not reduce the user experience?
The question is completely legitimate but the user experience is not reduced at all.
The user will not experience a spectacular change in the appearance of the page since neither content nor noticeable quality deterioration occurs during the optimization of the graphic elements. However, the page will be much faster since the amount of data that needs to be loaded/downloaded can be reduced with optimization. And rather than worsening it, this greatly improves the user experience.

